Wednesday, December 8, 2010

Cherry stone clams... And Quahogs?

Ok I can understand a cherrystone clam, even if they don't actually taste like a cherrystone. But a Quahog isn't where Peter Griffin from Family guy lives? My world is shattered.
The designation of a cherrystone is indicative of the actual size of the clam. The clam is known as a Chowder clam. Chowder clams are edible and found in North America. These clam's size are denoted by the fisherman that catch them as Cherrystone for the small ones and Quahogs as the large ones.... I thought it was weird too. Why not call the small ones small clams and the larger clams the large ones. Oh well, guess that's why I'm not a fisherman.
Cherrystone Clams
A Quahog
Also a Quahog

Waves that just don't fit in... Rogue Waves

Rogue waves, also known as freak,abnormal, and killer waves; are waves that are very large in comparison to other waves around it and are fairly anomalous in the ocean.They can be defined by a wave that has a height of more than twice the significant wave height. Rogue waves are not to be confused with their cousin, the tsunami. Tsunami are caused by an earthquake, whereas rogue waves are formed by strong winds and current.
 
Rogue waves.... Not a good thing for a small boat

Due to the quick and violent nature of the rogue wave, estimates of how many sailors have lost their lives to them is unknown, however rogue waves have been implicated in sever ship losses.

Rogue wave..... Even a problem for bigger boats
Rogue waves have surfaced not only in the ocean, but also in movies like "The Perfect Storm" and "The Poseidon Adventure".

Environmental Sensitivity Index Maps!

Environmental Sensitivity Index maps (ESI maps) are useful for determining what kind of resources are available at a glance. ESI maps are used to chart things from plants to animals and are overlain on top of topographic maps of the area of interest. In the world, people like engineers and environmental groups can utilize ESI maps to view what types of animals or plants that can be impacted from events such as oil spills. By utilizing ESI maps, cleanup crews can reduce the impact a spill or other event can have on the environment by targeting the most important areas rather than wasting time on areas that are not as species dense. Below is an example of an ESI map of the Caribbean.

Monday, November 1, 2010

Icebergs!

Icebergs are, "a large mass of ice floating at sea; usually broken off of a polar glacier" and are found usually near the pole regions of the world.
Below is an aerial view of the North Pole


Next is an aerial view of the South Pole


Below is a representation of an Iceberg, note that most of the iceberg is under the waterlevel


When an iceberg is stressed to the point that the water crystalline matrix cannot support the weight of the ice above it, This happens! (Note: Look for what seems to be a frozen ship in the video)  CLICK HERE!!!
The weight causes a shear in the matrix that cleaves in an almost straight  plane. 

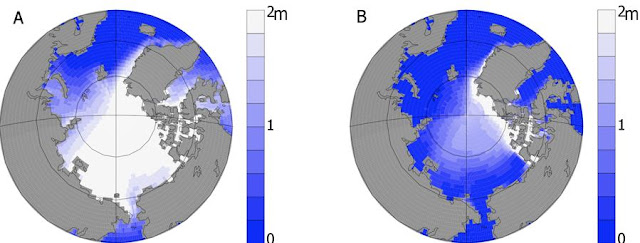
Ice at the poles differs at certain times of the year. The picture below shows the pole at March (A) and September (B).


Wednesday, October 20, 2010

Light Attenuation in the Ocean

As light travels through the water column, it is absorbed and reflected by objects that are in the water, like dissolved sediments, ions, and by water molecules themselves. The decrease in surface light at a given depth in the water column is called "Light Attenuation". Light attenuation is an important factor for autotrophic organisms that which depend on a specific wavelength of light to photosynthesize food. These organisms are limited in how deep they can live depending on their specific wavelength of light, as some wavelengths can travel deeper than others. Shorter wavelength high energy waves, such as blue and violet, travel much deeper in the water column than longer wavelength low energy waves, such as red and infra red. Light attenuation is calculated by multiplying the incident (surface) light by the exponential of negative attenuation constant (different for every wavelength) and the depth (in Meters). Written out, Iz= IoE(-KZ). Figure 1, shown below, is a graphical representation of several wavelengths of light and their percent transmittance (amount of remaining surface light) at a given depth.

Thursday, September 30, 2010

Journal Articles

El Nino and La Nina
Article: "Impact of El NiƱo / Southern Oscillation on Low-flows in South Georgia, USA". Pierre G.F. Gerard- Marchant and David E. Stooksbury. Southeastern Geographer 2010 p. 218-243

Purpose and Results: This research takes a look at the influence of the El Nino/La Nina weather patterns influence on several streams in Georgia. Several streams in Georgia were evaluated at different times of the year and evaluate the effect of the weather patterns on the low-flows of the streams. Gerard- Marchant and Stooksbury found that the low-flows were lower in the months of the El Nino/ La Nina climate events and higher in the neutral months of the year such as November to April.

Red Tide
Article:"Implications of Harmful Microalgae and Heterotrophic Dinoflagellates in management of sustainableMarine Fisheries". JoAnn M. Burkholder.  Ecological Applications 1998 p. 37-62
 Purpose and Results: This article looks at the many types of  Dinoflagellates that cause harm to fish and lists the toxins they produce. Red tide can be a very big problem in a fishery due to the large amount of fish produced there and the intended use of those fish, feeding a population. Burkholder goes on to note that Dinoflagellates and Red tide can," Accumulating evidence indicates that these harmful species significantly affect marine fisheries at the population level, well beyond the obvious acute impacts of fish kills" (p. 54). This shows that Marine fisheries can be in great danger not only due to lost fish, but also a threat to its potential consumer.
Figure 1. Web map of Red Tide toxin in fish.  (Borrowed from Burkholder)

Burkholder goes on to state that there is a need for the Red Tide toxins to be identified and an economical means of testing and remediation need to be researched.


Monday, September 13, 2010

Hypsographic Curves: What are they and how are they useful?

A Hypsographic curve is a graphical representation of the depth of a body of water at certain intervals.Hypsographic curves are used to understand the depth and the curvature of a lake or a pond. The volume of the lake can also be garnered from the hypsographic curve by averaging the layers or slices of the curve.
Chart 1 is the plot of depth vs. area of a Lake
                                                                           Chart 1
Chart 2 is the depth vs. volume of the same lake
                                                                        Chart 2
Want to have fun making your own Hypsographic curves of your favorite lakes or ponds?! Then click HERE!! 

Monday, August 30, 2010

The Artifical reef, USS Oriskany

About 22 miles off the coast of Pensacola Florida coast, covered by over 200 feet of water lies the USS Oriskany. The USS Oriskany was a aircraft supercarrier used in the Vietnam conflict and the Korean war, seeing over 12,000 combat missions. The carrier suffered a large fire on October 26, 1966 when a flare ignited a weapons bay and took the lives of 44 men. The Oriskany was decommissioned ten years later and was slowly cannibalized for parts until 1995 when it was sold for scrap. After being sold for scrap the supercarrier was towed to the coast of Florida, where the enormous task to clean up the carrier for its future use.

The USS Oriskany was made, in 2006, the largest man-made reef in the world. Now commonly known as "The Mighty O" or "The Great Carrier Reef", the Oriskany is now a tourist site for recreational divers. I would like to go see the remains of the Oriskany in a dive. This is the place that I want to visit the most because of the types of fish that can be seen living in the carrier. I also think that the preparation work required to convert the carrier from war machine to fish habitat is also astounding due to the size of the Oriskany. Below is a video of the sinking of the Oriskany done in 2006. The other is a video of the the Oriskany looked like only after two years of being on the sea floor.

                                                            VIDEOS!!
She sinks http://www.youtube.com/watch?v=1TNK0GM3OvU
The Great Carrier Reef http://www.youtube.com/watch?v=Cz8NvE_mi9I

All pictures courtesy of Wikipedia and all video courtesy of youtube