The designation of a cherrystone is indicative of the actual size of the clam. The clam is known as a Chowder clam. Chowder clams are edible and found in North America. These clam's size are denoted by the fisherman that catch them as Cherrystone for the small ones and Quahogs as the large ones.... I thought it was weird too. Why not call the small ones small clams and the larger clams the large ones. Oh well, guess that's why I'm not a fisherman.

Cherrystone Clams
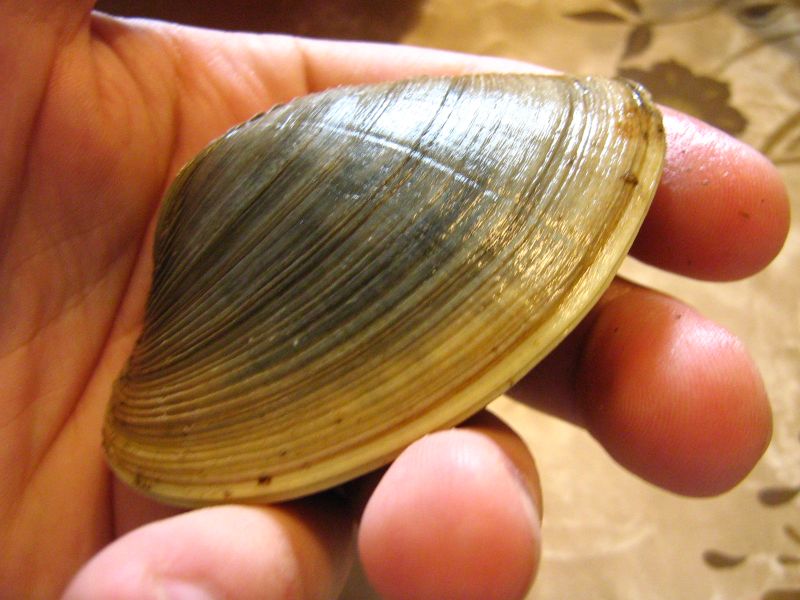
A Quahog

Also a Quahog


